Forecast Ops tab — accuracy & MAPE
Dashboard → Forecast → Ops.
This tab answers: “How wrong were yesterday’s (and recent) locked-in predictions compared to what actually sold?”
It does not change the live 30-day forecast chart. It only scores past calendar days that already left the live horizon and were kept for vs-actual comparison.
What you see on the screen
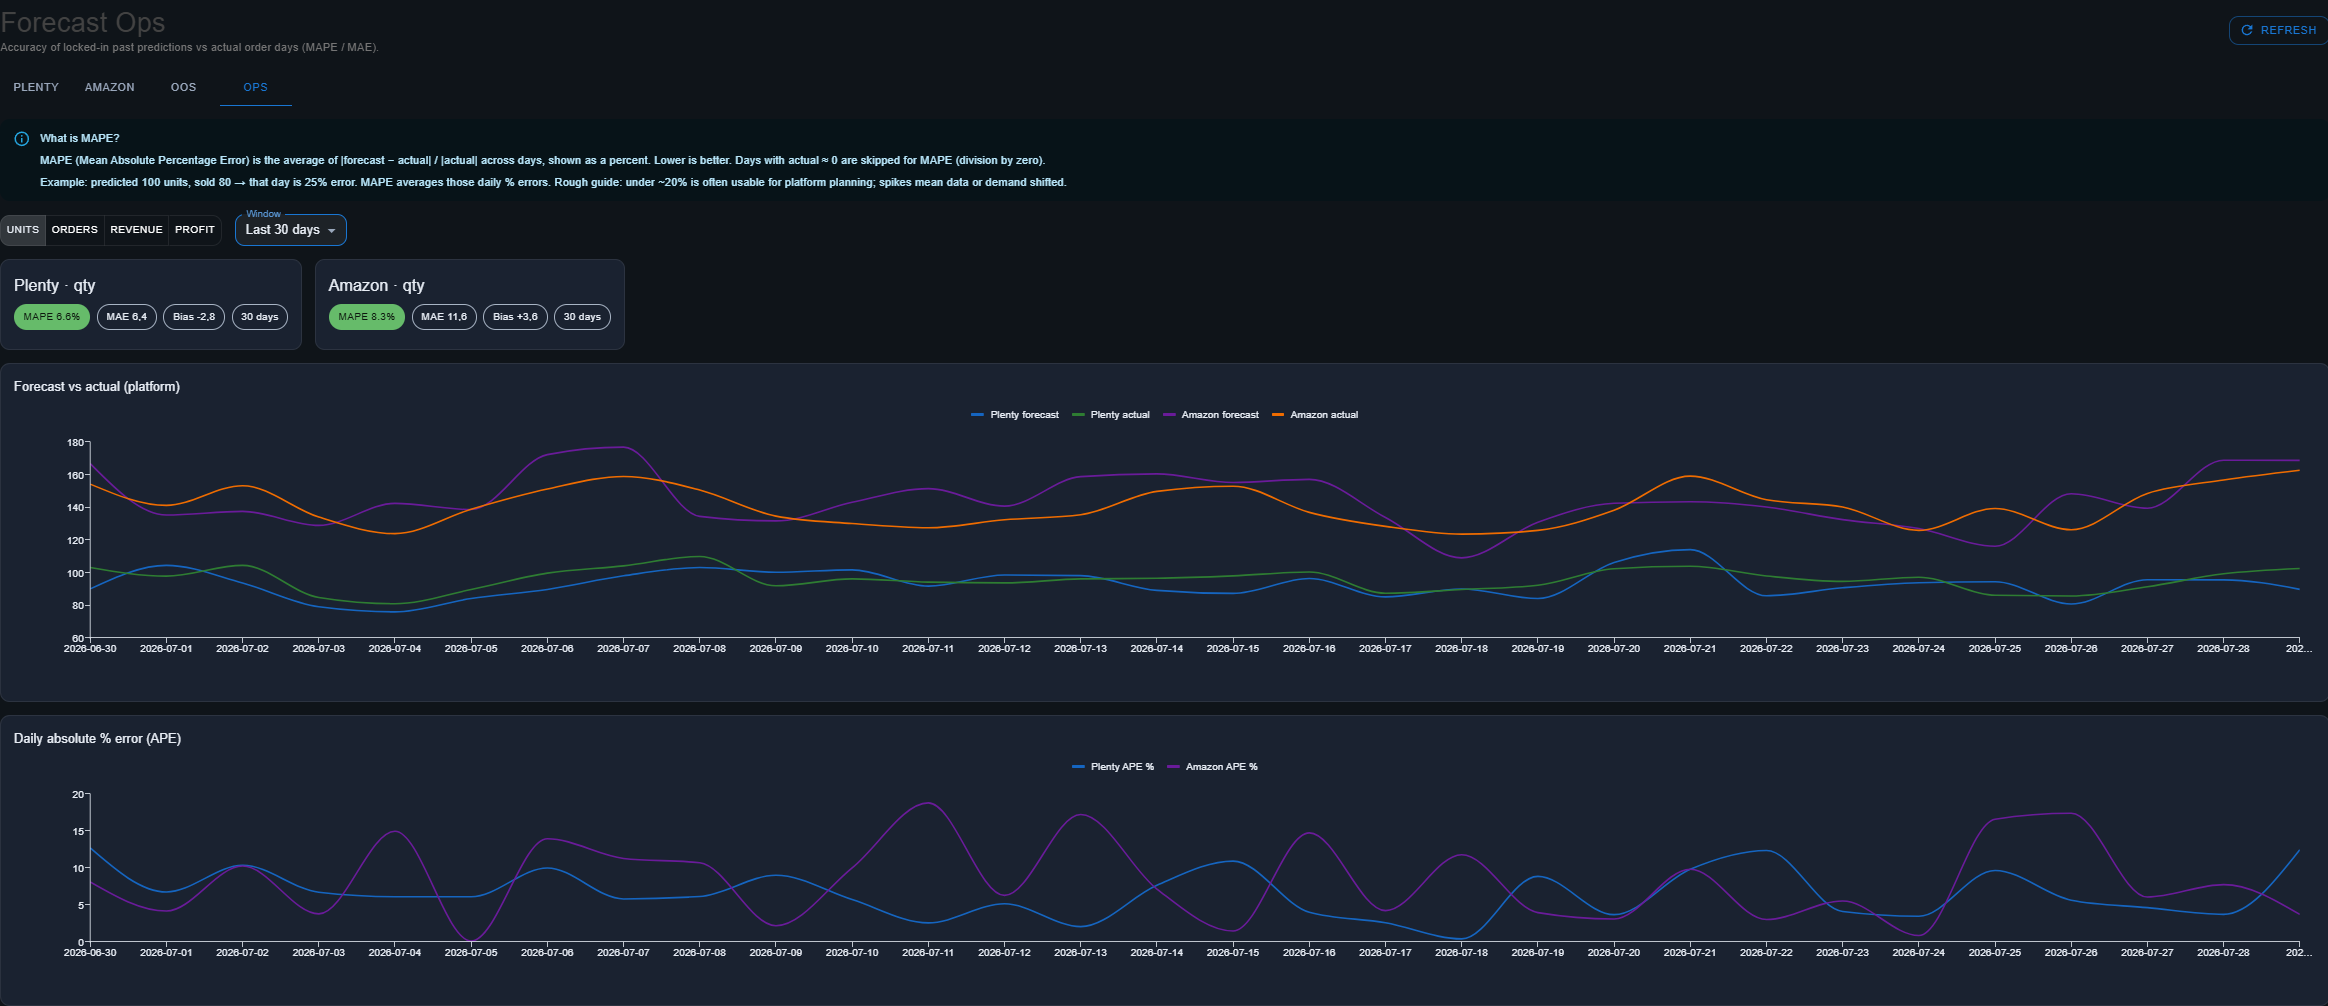
Example Ops view (seed / early data): Units · last 30 days. Plenty MAPE 8.2% (green), Amazon MAPE 8.3% (green). Top chart = forecast vs actual for both platforms; bottom chart = daily APE %.
| UI block | Purpose |
|---|---|
| What is MAPE? | Short definition so ops can read chips without opening docs |
| Tune / Fill buttons | Fill MAPE from history = walk-forward backtest; Tune params (Optuna) = HPO |
| Stored params table | Best LightGBM knobs from last Optuna run (empty → defaults) |
| Metric toggle | Units / Orders / Revenue / Profit — same independent targets as training |
| Window | Last 7 / 14 / 30 / 90 scored days (ends at yesterday) |
| Summary cards | One card per source: MAPE, MAE, Avg offset (too high / too low + %), day count |
| Forecast vs actual | Overlaid daily lines: predicted vs sold (Plenty blue/green, Amazon purple/orange) |
| Daily APE % | Per-day absolute percentage error (building blocks of MAPE) |
Metrics explained
APE (Absolute Percentage Error) — one day
[ \text{APE} = \frac{|\text{forecast} - \text{actual}|}{|\text{actual}|} ]
Shown in the UI as APE % (= APE × 100).
| Example | Forecast | Actual | APE % |
|---|---|---|---|
| Slight miss | 100 | 90 | 11.1% |
| Large miss | 100 | 50 | 100% |
| Exact | 80 | 80 | 0% |
Special case: if actual ≈ 0, APE is undefined (division by zero). Those days are excluded from MAPE but can still appear in the forecast-vs-actual chart with a low actual line.
MAPE (Mean Absolute Percentage Error) — many days
[ \text{MAPE} = \frac{1}{n}\sum_{i=1}^{n} \text{APE}_i \quad (\text{as percent in the UI}) ]
Average of the daily APE values over the selected window (only days with a valid APE).
| Rough guide (platform totals) | Interpretation |
|---|---|
| < ~15% | Chip green — usable for planning headlines |
| ~15–30% | Chip yellow — watch; check promotions / stockouts / data gaps |
| > ~30% | Chip red — investigate before trusting that metric for ops decisions |
These thresholds are heuristic for platform grain, not financial SLAs. Product-level MAPE is usually noisier and is not shown in v1 Ops.
MAE (Mean Absolute Error)
[ \text{MAE} = \frac{1}{n}\sum |\text{forecast} - \text{actual}| ]
Average miss in raw units of the metric (units, orders, €).
Useful when actuals are small: MAPE can look huge on a 2 vs 3 unit day while MAE stays tiny.
Bias / avg offset
[ \text{Bias} = \frac{1}{n}\sum (\text{forecast} - \text{actual}) ]
Also shown as mean percentage offset: mean((\text{forecast} - \text{actual}) / |\text{actual}|) × 100 (days with actual ≈ 0 skipped).
| Sign | Meaning |
|---|---|
| Positive | Over-forecast on average (we predicted more than sold) — chip says too high |
| Negative | Under-forecast on average — chip says too low |
| Near zero | Errors cancel; MAPE can still be high if swings go both ways — chip says on target |
Bias alone is not “accuracy” — combine with MAPE/MAE.
How to read the charts
Forecast vs actual
In the screenshot: Plenty forecast (blue) vs Plenty actual (green), Amazon forecast (purple) vs Amazon actual (orange).
- Forecast lines = what the model said for that calendar day when that day was still in a past horizon (locked-in row).
- Actual lines = aggregated sales from
plenty_orders/amazon_ordersfor that day (same idea as training panels). - If a forecast line sits above its actual line most days → consistent over-forecast (matches positive bias; Amazon in the example is about +3 units).
- If a forecast line sits below actual → under-forecast (negative bias; Plenty example about −2).
- Lines that track closely with small day-to-day wiggles → healthy platform MAPE (example ~8%).
Daily APE %
- Flat-ish band under ~15–20% → stable relative error (matches green MAPE chips in the example).
- Spike on one date → dig into that day’s orders / stock / channel mix; MAPE for the whole window will be pulled up by that day.
- Amazon and Plenty on the same plot are independent models; do not expect identical APE.
Where the numbers come from
| Field in forecast_accuracy_daily | Meaning |
| ---------------------------------- | ------------------------------------------------------- | ----------------- | --- |
| source | plenty or amazon |
| granularity / unique_id | v1 Ops uses platform / plenty__ALL or amazon__ALL |
| metric | qty | orders | revenue | profit |
| eval_ds | Calendar day being scored |
| forecast_value | Locked-in prediction for that day |
| actual_value | Real aggregated sales that day |
| abs_error | | forecast − actual | |
| ape | APE as a fraction (0–1); NULL if actual ≈ 0 |
| model_run_at | Which forecast run produced the locked-in value |
| computed_at | When the accuracy row was written |
API used by the tab:
GET /api/v1/forecast/accuracy?source=both&days=30&metric=qty&granularity=platform
Response includes summaries[] (MAPE/MAE/bias) and series[] (per-day points for charts), plus mape_explained text for the banner.
Local / empty DB: seed example data
If Ops shows “No accuracy rows yet”, seed demo rows:
cd backend/service_forecast
# Host machine talking to local Postgres (not the Docker hostname `postgres`):
set DATABASE_URL=postgresql://USER:PASS@localhost:5432/lage_db
python scripts/seed_forecast_accuracy.py
That writes ~30 days × Plenty/Amazon × qty/orders into forecast_accuracy_daily so you can design/verify the UI. Replace with real scoring once you have either locked-in production days or a walk-forward backtest.
DDL:
docker/postgres/tables/forecast_accuracy_daily.sqldocker/postgres/updates/forecast_accuracy_daily.sql
Walk-forward backtest
Before many locked-in cron days exist (or to validate after a model change), run an offline expanding-origin backtest. Tuning drops the last 1 calendar day from today by default (incomplete orders); hold-out defaults to off.
# Plenty only
curl -X POST "http://localhost:8008/api/v1/forecast/backtest?source=plenty&wait=true"

# Amazon only
curl -X POST "http://localhost:8008/api/v1/forecast/backtest?source=amazon&wait=true"
Or as part of Optuna (Ops UI can set source / trials / folds / hold-out):
curl -X POST "http://localhost:8008/api/v1/forecast/hpo?source=plenty&n_trials=30&holdout_days=14"
Both upsert platform-grain day scores into forecast_accuracy_daily (same table Ops reads). That MAPE is honest historical accuracy under the current code; it can differ slightly from “locked-in cron” MAPE if features/params changed after those production rows were written.
Anti-overfit: walk-forward expanding CV selects params; optional hold-out (FORECAST_HPO_HOLDOUT_DAYS, default 0) reserves days before the exclude cut for a one-shot unseen score. Ops charts refresh platform actuals from live order tables on each load so MAPE is not stuck on stale zeros from an earlier backtest.
Do not train on “all history except a middle month” while still including days after that month — that leaks the future. Walk-forward only trains on ds ≤ origin.
See How predictions work — Optional Optuna HPO.
What Ops is not
- Not a substitute for the Plenty/Amazon forecast charts (those show the live future horizon).
- Not hierarchical reconciliation (platform MAPE ≠ average of SKU MAPEs).
- Not yet an automated alert or Discord webhook (phase later).
- Seeded values are synthetic — do not use seed MAPE for business decisions.
Practical checklist for ops
- Open Ops, pick Units, window 30 days.
- Check Plenty and Amazon MAPE chips (green / yellow / red).
- Open Forecast vs actual — do lines track, or is one systematically high/low?
- Check Avg offset — too high / too low for purchasing intuition.
- If MAPE spiked, use Daily APE % to find the bad day(s), then inspect orders / stockouts / imports for that date.
- Repeat for Orders / Revenue if those drive the decision (metrics are trained separately).
Related
- Forecast service overview
- How predictions work — locked-in past
dsretention - Metabase vs-actual SQL examples on the overview